Yes I am using defaults on both machines. 1 machine is plotting, the other is just a replotter. 2hrs now. More misses and no hits. up to 9 misses on one machine and 4 on the other. I’m going to test the other build you just posted now since this one seems to not work. I would rather have the high ram usage then the misses, the ram really never bothered me much personally. Althrough I know a lot of people complain about it.
1 Like
Please also post benchmarking results when you can ![]()
Ram leak is back in this one. Will let you know about hits/misses in an hour or so.
Looks like I’ve signed a few hashes on both machines.
Okay, so regression seems to be due to the unbuffered I/O change, interesting…
Now I’m curious about benchmarks, there should be a way to recover performance while having lower memory usage.
I’m afraid you’ll have to walk me through whatever you want me to do with benchmarking as I’ve never done it.
Audit nvme:
E:\chia>subspace-farmer-windows-x86_64-skylake-unbuffered-farming-io-windows.exe benchmark audit j:\sub
Benchmarking audit/plot/rayon/unbuffered
Benchmarking audit/plot/rayon/unbuffered: Warming up for 3.0000 s
Benchmarking audit/plot/rayon/unbuffered: Collecting 10 samples in estimated 7.8698 s (110 iterations)
Benchmarking audit/plot/rayon/unbuffered: Analyzing
audit/plot/rayon/unbuffered
                        time:   [71.074 ms 71.267 ms 71.518 ms]
                        thrpt:  [ 51419 GiB/s  51600 GiB/s  51740 GiB/s]
Found 1 outliers among 10 measurements (10.00%)
  1 (10.00%) high mild
Benchmarking audit/plot/rayon/regular
Benchmarking audit/plot/rayon/regular: Warming up for 3.0000 s
Benchmarking audit/plot/rayon/regular: Collecting 10 samples in estimated 7.9083 s (110 iterations)
Benchmarking audit/plot/rayon/regular: Analyzing
audit/plot/rayon/regular
                        time:   [71.055 ms 71.346 ms 71.734 ms]
                        thrpt:  [ 51265 GiB/s  51543 GiB/s  51754 GiB/s]
audit SSD 8tb samsung
E:\chia>subspace-farmer-windows-x86_64-skylake-unbuffered-farming-io-windows.exe benchmark audit G:\sub
Benchmarking audit/plot/rayon/unbuffered
Benchmarking audit/plot/rayon/unbuffered: Warming up for 3.0000 s

Warning: Unable to complete 10 samples in 5.0s. You may wish to increase target time to 5.7s or enable flat sampling.
Benchmarking audit/plot/rayon/unbuffered: Collecting 10 samples in estimated 5.6567 s (55 iterations)
Benchmarking audit/plot/rayon/unbuffered: Analyzing
audit/plot/rayon/unbuffered
                        time:   [99.532 ms 100.73 ms 102.27 ms]
                        thrpt:  [ 23264 GiB/s  23618 GiB/s  23903 GiB/s]
                 change:
                        time:   [+38.329% +40.802% +43.292%] (p = 0.00 < 0.05)
                        thrpt:  [-30.212% -28.979% -27.709%]
                        Performance has regressed.
Found 3 outliers among 10 measurements (30.00%)
  1 (10.00%) low mild
  2 (20.00%) high mild
Benchmarking audit/plot/rayon/regular
Benchmarking audit/plot/rayon/regular: Warming up for 3.0000 s

Warning: Unable to complete 10 samples in 5.0s. You may wish to increase target time to 5.5s or enable flat sampling.
Benchmarking audit/plot/rayon/regular: Collecting 10 samples in estimated 5.4870 s (55 iterations)
Benchmarking audit/plot/rayon/regular: Analyzing
audit/plot/rayon/regular
                        time:   [97.278 ms 99.266 ms 101.12 ms]
                        thrpt:  [ 23528 GiB/s  23967 GiB/s  24457 GiB/s]
                 change:
                        time:   [+37.577% +39.987% +42.471%] (p = 0.00 < 0.05)
                        thrpt:  [-29.810% -28.565% -27.313%]
                        Performance has regressed.
Prover SSD 8TB samsung(qlc)
E:\chia>subspace-farmer-windows-x86_64-skylake-unbuffered-farming-io-windows.exe benchmark prove G:\sub
Benchmarking prove/plot/rayon/unbuffered
Benchmarking prove/plot/rayon/unbuffered: Warming up for 3.0000 s

Warning: Unable to complete 10 samples in 5.0s. You may wish to increase target time to 7.7s.
Benchmarking prove/plot/rayon/unbuffered: Collecting 10 samples in estimated 7.7349 s (10 iterations)
Benchmarking prove/plot/rayon/unbuffered: Analyzing
prove/plot/rayon/unbuffered
                        time:   [738.18 ms 753.58 ms 766.59 ms]
Found 2 outliers among 10 measurements (20.00%)
  2 (20.00%) low mild
Benchmarking prove/plot/rayon/regular
Benchmarking prove/plot/rayon/regular: Warming up for 3.0000 s

Warning: Unable to complete 10 samples in 5.0s. You may wish to increase target time to 7.7s.
Benchmarking prove/plot/rayon/regular: Collecting 10 samples in estimated 7.7461 s (10 iterations)
Benchmarking prove/plot/rayon/regular: Analyzing
prove/plot/rayon/regular
                        time:   [754.04 ms 765.35 ms 775.35 ms]
Prover NVME 4TB
E:\chia>subspace-farmer-windows-x86_64-skylake-unbuffered-farming-io-windows.exe benchmark prove I:\sub
Benchmarking prove/plot/rayon/unbuffered
Benchmarking prove/plot/rayon/unbuffered: Warming up for 3.0000 s
Benchmarking prove/plot/rayon/unbuffered: Collecting 10 samples in estimated 9.0154 s (20 iterations)
Benchmarking prove/plot/rayon/unbuffered: Analyzing
prove/plot/rayon/unbuffered
                        time:   [458.71 ms 481.08 ms 504.31 ms]
                        change: [-39.332% -36.161% -32.854%] (p = 0.00 < 0.05)
                        Performance has improved.
Benchmarking prove/plot/rayon/regular
Benchmarking prove/plot/rayon/regular: Warming up for 3.0000 s
Benchmarking prove/plot/rayon/regular: Collecting 10 samples in estimated 9.1011 s (20 iterations)
Benchmarking prove/plot/rayon/regular: Analyzing
prove/plot/rayon/regular
                        time:   [459.24 ms 481.20 ms 505.72 ms]
                        change: [-39.931% -37.127% -33.835%] (p = 0.00 < 0.05)
                        Performance has improved.
According to these numbers it should not have any issues farming ![]()
@dragonP @PuNkYsHuNgRy on first start there will be significant writes to all disks, did you all wait for them to finish and for disk usage to decrease to normal level?
It only took ~30 minutes on my 2T NVMe farm, but can take longer depending on disk. It also doesn’t apply to larger than 2T farms. While this write is happening I can see how it would miss rewards, but it should be faster than ever before when done with those writes.
This is result for subspace-farmer-windows-x86_64-skylake-farmer-caching-tweaks.exe. All run by default value, no miss but I think plot time is longer. But RAM leak issue is still there.
To answer your question “on first start there will be significant writes to all disks, did you all wait for them to finish and for disk usage to decrease to normal level?” >> of course I had to wait. Otherwise how could I farm/plot? And remember, my result that I’ve shared was 6 hours so I’ve gone through this.
Can you post your benchmarks on problematic farms?
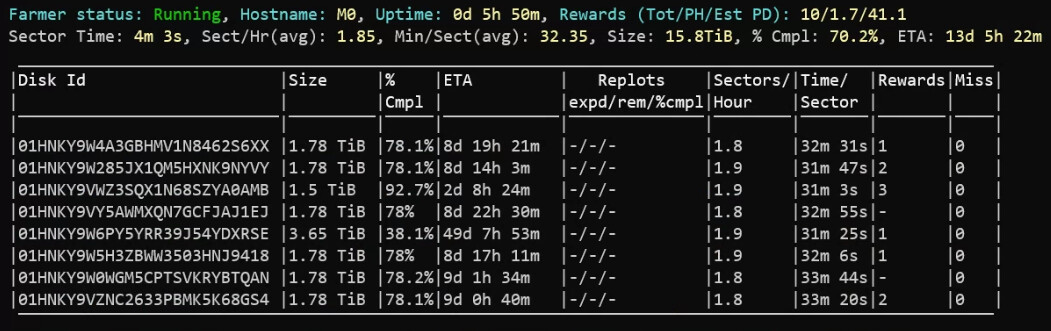
M0 is the same machine where I run both subspace-farmer-windows-x86_64-skylake-farmer-caching-tweaks.exe and subspace-farmer-windows-x86_64-skylake-unbuffered-farming-io-windows.exe
Below is benchmark result for subspace-farmer-windows-x86_64-skylake-farmer-caching-tweaks.exe
Note: C drive is NVMe, K drive is SSD.
PS C:\Subspace Farmer> .\subspace-farmer3h_4Mar.exe benchmark audit C:\1
Benchmarking audit/plot/rayon
Benchmarking audit/plot/rayon: Warming up for 3.0000 s
Benchmarking audit/plot/rayon: Collecting 10 samples in estimated 5.9244 s (275 iterations)
Benchmarking audit/plot/rayon: Analyzing
audit/plot/rayon        time:   [20.968 ms 21.293 ms 21.768 ms]
                        thrpt:  [ 62852 GiB/s  64257 GiB/s  65251 GiB/s]
Found 1 outliers among 10 measurements (10.00%)
  1 (10.00%) high mild

PS C:\Subspace Farmer> .\subspace-farmer3h_4Mar.exe benchmark prove C:\1
Benchmarking prove/plot/rayon
Benchmarking prove/plot/rayon: Warming up for 3.0000 s

Warning: Unable to complete 10 samples in 5.0s. You may wish to increase target time to 6.7s.
Benchmarking prove/plot/rayon: Collecting 10 samples in estimated 6.7052 s (10 iterations)
Benchmarking prove/plot/rayon: Analyzing
prove/plot/rayon        time:   [672.08 ms 677.67 ms 683.20 ms]

PS C:\Subspace Farmer> .\subspace-farmer3h_4Mar.exe benchmark audit K:\1
Benchmarking audit/plot/rayon
Benchmarking audit/plot/rayon: Warming up for 3.0000 s
Benchmarking audit/plot/rayon: Collecting 10 samples in estimated 5.7384 s (110 iterations)
Benchmarking audit/plot/rayon: Analyzing
audit/plot/rayon        time:   [52.084 ms 52.256 ms 52.439 ms]
                        thrpt:  [ 26091 GiB/s  26182 GiB/s  26269 GiB/s]
                 change:
                        time:   [+142.03% +146.11% +149.82%] (p = 0.00 < 0.05)
                        thrpt:  [-59.971% -59.367% -58.683%]
                        Performance has regressed.

PS C:\Subspace Farmer> .\subspace-farmer3h_4Mar.exe benchmark prove K:\1
Benchmarking prove/plot/rayon
Benchmarking prove/plot/rayon: Warming up for 3.0000 s

Warning: Unable to complete 10 samples in 5.0s. You may wish to increase target time to 7.5s.
Benchmarking prove/plot/rayon: Collecting 10 samples in estimated 7.5023 s (10 iterations)
Benchmarking prove/plot/rayon: Analyzing
prove/plot/rayon        time:   [739.73 ms 744.26 ms 748.33 ms]
                        change: [+8.7109% +9.8258% +10.928%] (p = 0.00 < 0.05)
                        Performance has regressed.
Found 2 outliers among 10 measurements (20.00%)
  1 (10.00%) low mild
  1 (10.00%) high mild
Below is benchmark result for subspace-farmer-windows-x86_64-skylake-unbuffered-farming-io-windows.exe
Note: C drive is NVMe, K drive is SSD.
PS C:\Subspace Farmer> .\subspace-farmer3h_3Mar benchmark audit C:\1
Benchmarking audit/plot/rayon/unbuffered
Benchmarking audit/plot/rayon/unbuffered: Warming up for 3.0000 s
Benchmarking audit/plot/rayon/unbuffered: Collecting 10 samples in estimated 5.8174 s (275 iterations)
Benchmarking audit/plot/rayon/unbuffered: Analyzing
audit/plot/rayon/unbuffered
                        time:   [20.552 ms 20.808 ms 21.177 ms]
                        thrpt:  [ 64608 GiB/s  65753 GiB/s  66573 GiB/s]
Found 4 outliers among 10 measurements (40.00%)
  2 (20.00%) low severe
  1 (10.00%) high mild
  1 (10.00%) high severe
Benchmarking audit/plot/rayon/regular
Benchmarking audit/plot/rayon/regular: Warming up for 3.0000 s
Benchmarking audit/plot/rayon/regular: Collecting 10 samples in estimated 5.9782 s (275 iterations)
Benchmarking audit/plot/rayon/regular: Analyzing
audit/plot/rayon/regular
                        time:   [20.783 ms 21.027 ms 21.183 ms]
                        thrpt:  [ 64589 GiB/s  65068 GiB/s  65833 GiB/s]

PS C:\Subspace Farmer> .\subspace-farmer3h_3Mar benchmark prove C:\1
Benchmarking prove/plot/rayon/unbuffered
Benchmarking prove/plot/rayon/unbuffered: Warming up for 3.0000 s

Warning: Unable to complete 10 samples in 5.0s. You may wish to increase target time to 6.5s.
Benchmarking prove/plot/rayon/unbuffered: Collecting 10 samples in estimated 6.5133 s (10 iterations)
Benchmarking prove/plot/rayon/unbuffered: Analyzing
prove/plot/rayon/unbuffered
                        time:   [668.16 ms 671.75 ms 674.89 ms]
Found 1 outliers among 10 measurements (10.00%)
  1 (10.00%) low mild
Benchmarking prove/plot/rayon/regular
Benchmarking prove/plot/rayon/regular: Warming up for 3.0000 s

Warning: Unable to complete 10 samples in 5.0s. You may wish to increase target time to 7.2s.
Benchmarking prove/plot/rayon/regular: Collecting 10 samples in estimated 7.2488 s (10 iterations)
Benchmarking prove/plot/rayon/regular: Analyzing
prove/plot/rayon/regular
                        time:   [674.58 ms 680.07 ms 686.00 ms]

PS C:\Subspace Farmer> .\subspace-farmer3h_3Mar benchmark audit K:\1
Benchmarking audit/plot/rayon/unbuffered
Benchmarking audit/plot/rayon/unbuffered: Warming up for 3.0000 s
Benchmarking audit/plot/rayon/unbuffered: Collecting 10 samples in estimated 5.7407 s (110 iterations)
Benchmarking audit/plot/rayon/unbuffered: Analyzing
audit/plot/rayon/unbuffered
                        time:   [52.002 ms 52.107 ms 52.244 ms]
                        thrpt:  [ 26189 GiB/s  26257 GiB/s  26311 GiB/s]
                 change:
                        time:   [+147.14% +149.20% +151.37%] (p = 0.00 < 0.05)
                        thrpt:  [-60.218% -59.871% -59.537%]
                        Performance has regressed.
Benchmarking audit/plot/rayon/regular
Benchmarking audit/plot/rayon/regular: Warming up for 3.0000 s
Benchmarking audit/plot/rayon/regular: Collecting 10 samples in estimated 5.7507 s (110 iterations)
Benchmarking audit/plot/rayon/regular: Analyzing
audit/plot/rayon/regular
                        time:   [52.078 ms 52.211 ms 52.304 ms]
                        thrpt:  [ 26159 GiB/s  26205 GiB/s  26272 GiB/s]
                 change:
                        time:   [+146.56% +148.36% +150.27%] (p = 0.00 < 0.05)
                        thrpt:  [-60.043% -59.736% -59.442%]
                        Performance has regressed.

PS C:\Subspace Farmer> .\subspace-farmer3h_3Mar benchmark prove K:\1
Benchmarking prove/plot/rayon/unbuffered
Benchmarking prove/plot/rayon/unbuffered: Warming up for 3.0000 s

Warning: Unable to complete 10 samples in 5.0s. You may wish to increase target time to 7.5s.
Benchmarking prove/plot/rayon/unbuffered: Collecting 10 samples in estimated 7.4846 s (10 iterations)
Benchmarking prove/plot/rayon/unbuffered: Analyzing
prove/plot/rayon/unbuffered
                        time:   [744.60 ms 752.21 ms 760.32 ms]
                        change: [+10.745% +11.979% +13.262%] (p = 0.00 < 0.05)
                        Performance has regressed.
Benchmarking prove/plot/rayon/regular
Benchmarking prove/plot/rayon/regular: Warming up for 3.0000 s

Warning: Unable to complete 10 samples in 5.0s. You may wish to increase target time to 7.5s.
Benchmarking prove/plot/rayon/regular: Collecting 10 samples in estimated 7.4908 s (10 iterations)
Benchmarking prove/plot/rayon/regular: Analyzing
prove/plot/rayon/regular
                        time:   [741.19 ms 746.81 ms 753.09 ms]
                        change: [+8.6272% +9.8143% +11.070%] (p = 0.00 < 0.05)
                        Performance has regressed.

PS C:\Subspace Farmer>
1 Like
I will run 6 hours with default value for subspace-farmer-windows-x86_64-skylake-unbuffered-farming-io-windows.exe and share result again. Last time, I’ve got 7/11 miss on this machine over 6 hours but I didn’t run with default value.
CLI: subspace-farmer3h_3Mar.exe farm path=C:\1,size=1600G path=E:\1,size=1900G path=F:\1,size=1900G path=H:\1,size=1900G path=I:\1,size=1900G path=J:\1,size=1900G path=K:\1,size=1900G path=L:\1,size=3900G --farm-during-initial-plotting true --node-rpc-url ws://192.168.2.205:9945 --metrics-endpoints 192.168.2.200:2222 --reward-address stxxxx
Result: I think I should stop. This time is a nightmare, missing 4/4 rewards.

P/S: this version has another issue in Windows also. I cannot close it, even I’ve tried many times in task manager, cannot close. I had to restart the machine to be able to farm with Feb 19 release.
If you can’t stop it, it must be still doing writes to disk that I mentioned before, are you sure those were over? Because if they are not, then it explains missed rewards as well.
As a farmer, I’d rather accept a fake display of high RAM usage than many missed rewards. It’s really painful to see that. Btw, I didn’t see intensive write to any disks when I closed the farmer instance. This was more than 1 hour after the test, not sure if disk write was still going on.
And on the first time of my test when I reported I missed 7/11 rewards on the same PC, I ran for 6 hours. I couldn’t close the farmer instance also, and I noticed the recent rewards were missed also. So disk write was still ongoing after 6 hours, in the background?
I contacted a Chinese miner using Windows in the social group。
He provided critical testing and data.


According to Microsoft’s documentation, MMF will access the file through a pointer every time it is opened. Of course, you can also find the offset through the pointer. The entire page will be mapped into memory every time it is accessed. This is the default behavior.
When using tools such as CacheSet, you can let Windows release the memory occupied by this part of mmf. The memory requested by the program cannot be released.
So the essential problem is that this is the default behavior of Windows and not a bug. Microsoft said that this part of memory can be released as other processes use it. So the easiest way to deal with this problem is to use lower-level MMF management, so I went to Three P/Invoke proposed
Just like EmEditor, even if you edit a large file, you can dynamically release the page instead of waiting for Windows to restore it.
I can’t possibly know that, which is why I asked you. There must be a VERY strong reason why application can’t be forced to exit and I saw that while disk writes were still happening myself, hence the question. If you are running a bit older test build with caching tweaks (or latest mar-04 release) and farm successfully, it should mean you finished writes and testing unbuffered I/O should not result in more missed rewards. All benches I did and that were shared here point to unbuffered I/O being as fast or a bit faster than old release, I’m puzzled why there are multiple reports of missed rewards unless writes were still happening ![]()
Thanks, but I don’t understand what was tested, how and why, so no idea what to do with it.
You mention memory-mapped files for the second time in this thread, but I already told you the first time we are NOT using them and not requesting Windows to create such mapping.
The fact that this is default behavior doesn’t mean this is not a bug. I definitely consider this default problematic behavior a bug that needs to be resolved.
I myself run the benchmark test for both builds, each run on NVMe and SATA (results shared above), the results are very good. But there was missed reward at very high rate. Not only me report this in the forum post.
I have no idea why I was able to farm successfully for build with caching tweaks. But then why the result with the build with unbuffered I/O, I ran 2 times and both resulting missed reward.
- First time, I ran for more than 6 hours with my own options, 7/11 missed
- Second time, I ran for about 1.5h with all default value, it’s even worse, 4/4 missed
Also just to note, I was able to close the build with caching tweaks instantly (as usual to all other formal releases).
I hope we’re almost there to control the RAM.
It does seem that Subspaces just uses the default File::Open provided by Rust to open the file and use read to read, so what does the P/Invoke they use correspond to?