Issue Report
Environment
SERVER 1
Components: Node (on 1TB SSD), Plotter, Cache (110GiB on 1TB SSD), Controller, NATs (all Docker)
Hardware: 10G NIC connected to 10G switch. RTX 3070. i7 12700KF
OS: Ubuntu 24.04 server
GPU Drivers: 560
SERVER 2
Components: Plotter, Controller, Cache (group1) (all Docker)
Hardware: 10G NIC connected to 10G switch. 2 x RTX 4090. Threadripper 3975WX
OS: Ubuntu 24.04 server
GPU Drivers: 560
SERVER 3
Components: Farmer (Docker)
Hardware: 2.5G NIC connected to 10G switch @ 2.5G. ARM CPU. 4x4TB NVMEs
OS: Debian GNU/Linux 12 (bookworm)
Problem
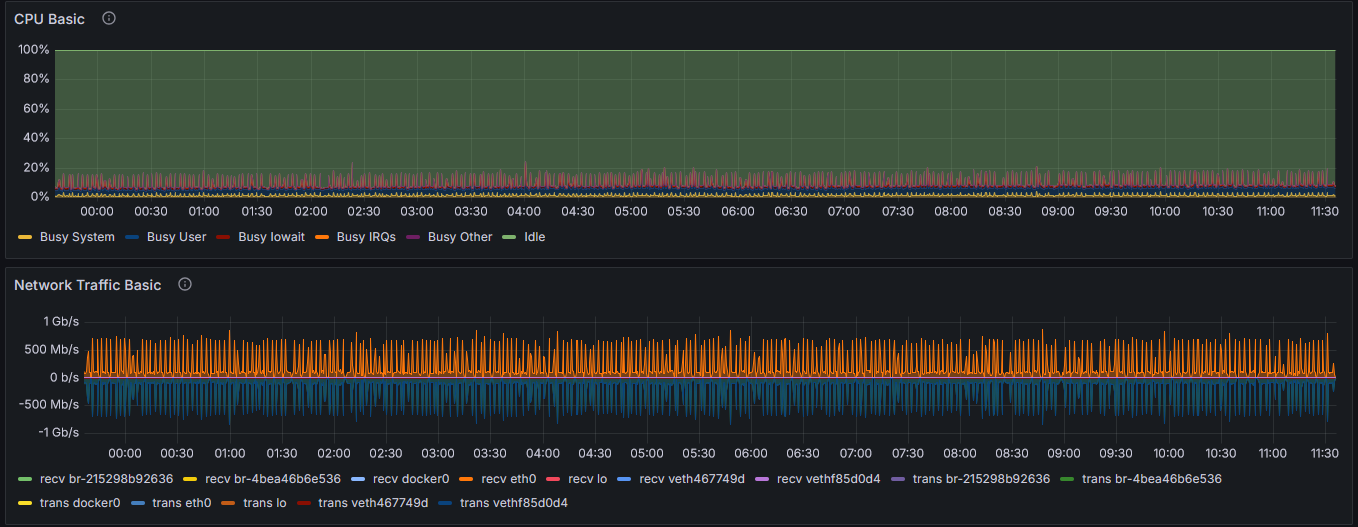
I am seeing very slow plotting with the RTX 3070. I am unsure if this is related to the network or my setup. Until recently I had seen very fast plot times with GPU. There are no errors on the Plotter or Farmer. The network is not saturated, I do see spikes periodically when there is a plot. Resources on both servers remain low (less than 20% CPU and RAM utilization).
I am happy to attach any relevant logs or screen shots. Here is a snippet of my plots to see times:
2024-10-09T14:00:42.862646Z  INFO {farm_index=3}:{sector_index=10}: subspace_farmer::single_disk_farm::plotting: Plotting sector (0.28% complete)
2024-10-09T14:00:13.124579Z  INFO {farm_index=1}:{sector_index=9}: subspace_farmer::single_disk_farm::plotting: Plotting sector (0.25% complete)
2024-10-09T14:00:12.171474Z  INFO {farm_index=1}:{sector_index=8}: subspace_farmer::single_disk_farm::plotting: Plotting sector (0.22% complete)
2024-10-09T14:00:11.912956Z  INFO {farm_index=1}:{sector_index=7}: subspace_farmer::single_disk_farm::plotting: Plotting sector (0.19% complete)
2024-10-09T14:00:11.683526Z  INFO {farm_index=1}:{sector_index=6}: subspace_farmer::single_disk_farm::plotting: Plotting sector (0.17% complete)
2024-10-09T14:00:11.396150Z  INFO {farm_index=1}:{sector_index=5}: subspace_farmer::single_disk_farm::plotting: Plotting sector (0.14% complete)
2024-10-09T13:57:24.187192Z  INFO {farm_index=0}:{sector_index=11}: subspace_farmer::single_disk_farm::plotting: Plotting sector (0.31% complete)
2024-10-09T13:57:06.113683Z  INFO {farm_index=0}:{sector_index=10}: subspace_farmer::single_disk_farm::plotting: Plotting sector (0.28% complete)
2024-10-09T13:54:50.512231Z  INFO {farm_index=0}:{sector_index=9}: subspace_farmer::single_disk_farm::plotting: Plotting sector (0.25% complete)
2024-10-09T13:54:48.515731Z  INFO {farm_index=0}:{sector_index=8}: subspace_farmer::single_disk_farm::plotting: Plotting sector (0.22% complete)
2024-10-09T13:54:41.028735Z  INFO {farm_index=0}:{sector_index=7}: subspace_farmer::single_disk_farm::plotting: Plotting sector (0.19% complete)
2024-10-09T13:54:40.760937Z  INFO {farm_index=0}:{sector_index=6}: subspace_farmer::single_disk_farm::plotting: Plotting sector (0.17% complete)
2024-10-09T13:54:40.758386Z  INFO {farm_index=0}:{sector_index=5}: subspace_farmer::single_disk_farm::plotting: Plotting sector (0.14% complete)
2024-10-09T13:52:22.453069Z  INFO {farm_index=0}:{sector_index=4}: subspace_farmer::single_disk_farm::plotting: Plotting sector (0.11% complete)
2024-10-09T13:52:07.213289Z  INFO {farm_index=0}:{sector_index=3}: subspace_farmer::single_disk_farm::plotting: Plotting sector (0.08% complete)